内容提要:
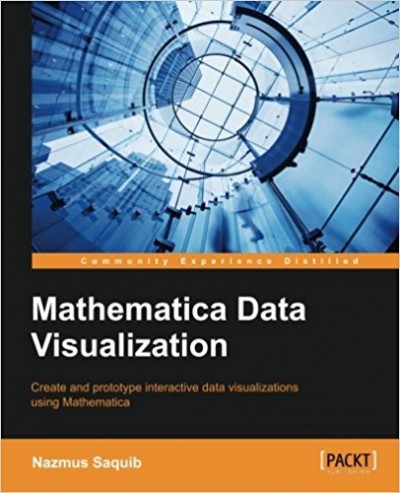
Mathematica, developed and maintained by Wolfram Research, is a trusted and popular tool used to analyze and visualize data.
This book begins by introducing you to the Mathematica environment and the basics of dataset loading and cleaning. You will then learn about the different kinds of widely used datasets so that you are comfortable with the later chapters. Then, in the subsequent chapters, you will learn about time series, scientific, statistical, information, and map visualizations. Each topic is demonstrated by walking you through an example project. Along the way, the dynamic interactivity and graphics packages are also introduced. Finally, the book ends with a brief discussion of color maps and aesthetics issues.
Using this book, you will learn how to build visualizations from scratch, quickly and efficiently.
What You Will Learn
- Understand some widely used datasets in science, engineering, finance, statistics, and business
- Write Mathematica programs to create stunning, interactive, and beautiful visualizations
- Create time series visualizations in different scenarios to find underlying patterns in time series data
- Build a protein molecule visualization tool and create basic isocontour and isosurface visualizations in Mathematica
- Create statistical plots and charts and learn the basics of visualizing high dimensional datasets
- Develop a word frequency visualization tool
- Build graph network visualizations and interactive chord charts
ISBN:1783282991
年份:2014
总页数:142
语言:English
文件大小:4.1 MB
文件格式:PDF
下载:关注本站公众号(右侧二维码),在 个性化-联系客服 中输入本文链接可获取文件下载链接。
 酷居科技
酷居科技

